- M.Cap: $6 billion | Debt: $4.4 billion | Cash: $49 million | EV: $6.17 billion
- EV/Revenue: 1.39X
- Volume: 168,110
- Major shareholders: Blackrock - 16.82% | Vanguard - 11.73% | Capital World Investors - 6.15% | State Street Corp. - 3.42% | Dimensional Fund - 3.35% | Invesco - 2.29% | Alliancebernstein - 2.26%
- Screen: Random.
I. Basics
The company provides mechanical and electrical contracting services.
Mechanical segment (77% of total revenue)
- Services include heating, ventilation and air conditioning ("HVAC"), plumbing, piping and controls, as well as off-site construction, monitoring and fire protection.
Electrical segment (23% of total revenue)
- Services include installation and servicing of electrical systems. The company build, install, maintain, repair and replace mechanical, electrical and plumbing systems throughout its 42 operating units with 169 locations in 128 cities throughout the United States.
Revenue split-up
- New construction: 49%
- Renovation/expansion/maintenance: 51%
Market size
- As per the company's estimate, the commercial, industrial, and institutional mechanical and electrical contracting generates annual revenue in the United States of approximately $350 billion.
II. Research
1. Largest specialty contractor
- The company is the 9th largest specialty contractor.
- https://www.enr.com/toplists/2021-Top-600-Specialty-Contractors-Preview
2. Solid financials
- Revenue grew from $1.1 billion in FY 2010 to $4.4 billion in LTM March 2023.
- During the same period, operating income increased by 14X, from $20 million to $289 million in LTM March 2023.
|
($, mm) |
FY 2013 |
FY 2014 |
FY 2015 |
FY 2016 |
FY 2017 |
FY 2018 |
FY 2019 |
FY 2020 |
FY 2021 |
FY 2022 |
LTM March 2023 |
|
Revenue |
1357 |
1411 |
1581 |
1634 |
1788 |
2183 |
2615 |
2857 |
3074 |
4140 |
4430 |
|
Gross profit |
240 |
250 |
318 |
344 |
366 |
446 |
502 |
547 |
563 |
742 |
794 |
|
Income from operations |
46 |
42 |
90 |
102 |
99 |
150 |
164 |
191 |
188 |
254 |
289 |
|
Net income |
27 |
23 |
49 |
65 |
55 |
113 |
114 |
150 |
143 |
246 |
216 |
3. Solid FCF
|
($, mm) |
FY 2013 |
FY 2014 |
FY 2015 |
FY 2016 |
FY 2017 |
FY 2018 |
FY 2019 |
FY 2020 |
FY 2021 |
FY 2022 |
LTM March 2023 |
|
CFO |
38 |
43 |
98 |
91 |
114 |
147 |
142 |
287 |
180 |
302 |
365 |
|
Capex |
17 |
19 |
21 |
23 |
35 |
27 |
32 |
24 |
22 |
48 |
56 |
|
FCF |
21 |
23 |
77 |
68 |
79 |
120 |
110 |
262 |
158 |
253 |
309 |
4. Roll-up strategy
- For the past 12 years, the company has spent over $1.3 billion on acquisitions.
|
Business name |
Cost ($, mm) |
Date |
|
Eldeco, Inc. |
74 |
February 2023 |
|
Atlantic Electric, LLC |
48 |
April 2022 |
|
MEP Holding Co., Inc. |
57 |
December 2021 |
|
Service and controls business in Kentucky |
21 |
December 2021 |
|
Ivey Mechanical Company, LLC |
79 |
December 2021 |
|
Amteck Holdco LLC |
139 |
August 2021 |
|
Mechanical contractor in Utah |
18 |
1st quarter 2021 |
|
Tennessee Electric Company, Inc. |
89 |
December 2020 |
|
TAS Energy Inc. |
170 |
April 2020 |
|
Electrical contractor in North Carolina |
42 |
1st quarter 2020 |
|
Walker TX Holding Company, LLC |
235 |
April 2019 |
|
BCH Holdings, Inc. |
121 |
April 2017 |
|
Environmental Air Systems, LLC (40%) |
47 |
January 2016 |
|
ShoffnerKalthoff family of companies |
20 |
1st quarter 2016 |
|
DynaTen Corporation |
41 |
May 2014 |
|
Environmental Air Systems, LLC (60%) |
30 |
November 2011 |
|
ColonialWebb Contractors Company |
110 |
July 2010 |
5. Stellar CEO
Brian E. Lane, CEO since December 2011
- 15X growth: Under the tenure of Mr. Lane, the company's market cap increased from $400 million in December 2011 to the current market cap of $5.8 billion.
- Ownership: Negligible
6. Pure Service: high margin and growing
- "Pure service" includes maintenance and repair.
- Pure service enjoys significantly higher gross margins
- The company has made substantial investments to expand its service and maintenance revenue. Growing its sales force and building service capabilities over the past several years is a major contributor for the improved financial performance.
|
($, mm) |
FY 2013 |
FY 2014 |
FY 2015 |
FY 2016 |
FY 2017 |
FY 2018 |
FY 2019 |
FY 2020 |
FY 2021 |
FY 2022 |
|
Revenue |
1357 |
1411 |
1581 |
1634 |
1788 |
2183 |
2615 |
2857 |
3074 |
4140 |
|
Pure service revenue as a % of total revenue |
17% |
18% |
18% |
18% |
19% |
NA |
15% |
13% |
13% |
13% |
|
Pure service revenue |
231 |
254 |
284 |
294 |
340 |
NA |
392 |
371 |
400 |
538 |
- In absolute value, the 'pure service' segment revenue is constantly growing
- Note: You can find "pure service" data from conference calls.
OUR COMMENTS
The company's prudent roll-up strategy involves using debt, but it successfully generates free cash flow, which is employed to repay the incurred debt.
Since January 2019, the company has acquired businesses totaling $970 million, while successfully maintaining stable debt levels and even reducing them to a 4-year low.
Debt
|
Debt ($, mm) |
FY 2019 |
FY 2020 |
FY 2021 |
FY 2022 |
QE Mar 2023 |
|
Total debt (excluding lease liabilities) |
226 |
235 |
388 |
256 |
210 |
We're still willing to borrow and we'll be paying down the little bit of debt we have pretty quickly. But you know what, we don't – we're not going to force acquisitions, we still think overtime we can average the growth that we have in the pass through acquisitions. – Q4 2015
Even with our acquisition expenditures, we were able to reduce our debt to less than one turn of trailing 12-month EBITDA. – Q4 2020
When Mr. Lane took charge as CEO, the company generated $20million. He grew the business steadily to become a business that generates $300 million of FCF.
Now, with $300 million of FCF, he can acquire larger businesses and continue to grow the business at a much higher rate.
Overall-
The crux of the research is tied to finding the length of the runway, i.e., how big the market is and how long the CEO can continue to acquire companies.
The thesis does not revolve around short-term price corrections or any speculative "catalyst" that could unlock the stock price.
The stock has the capacity for substantial growth, with the momentum of the roll-up strategy capable of snowballing into a much larger organization. This stock is strictly for long-term investment.
FURTHER RESEARCH
TOP 100 CONTRACTORS
https://www.phcppros.com/ext/resources/documents/p/h/c/0/phc04_2012.pdf
Page 28
https://www.enr.com/toplists/2021-Top-600-Specialty-Contractors-Preview
CAPITAL RETURNED
($ in thousands)
|
FISCAL PERIODS |
SHARE REPURCHASES |
DIVIDENDS |
CAPITAL RETURNED |
|
2015 |
$8,330 |
$9,358 |
$17,688 |
|
2016 |
$13,088 |
$10,264 |
$23,352 |
|
2017 |
$9,007 |
$10,987 |
$19,994 |
|
2018 |
$28,533 |
$12,268 |
$40,801 |
|
2019 |
$19,550 |
$14,543 |
$34,093 |
|
2020 |
$30,120 |
$15,499 |
$45,619 |
|
2021 |
$27,054 |
$17,384 |
$44,438 |
|
2022 |
$38,216 |
$20,077 |
$58,293 |
CONSTRUCTION BACKLOG
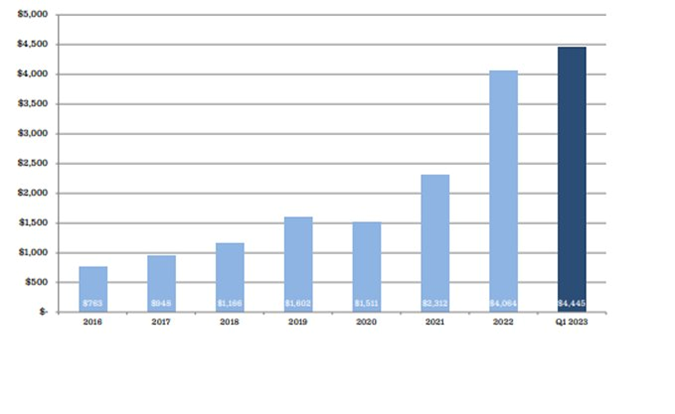
($ in millions)